A receipt for every sale
Every tracked purchase opens into the exact ad touches, sessions and events that produced it. When a number looks off, you don't debate it. You read the receipt.
Every purchase, one filterable list
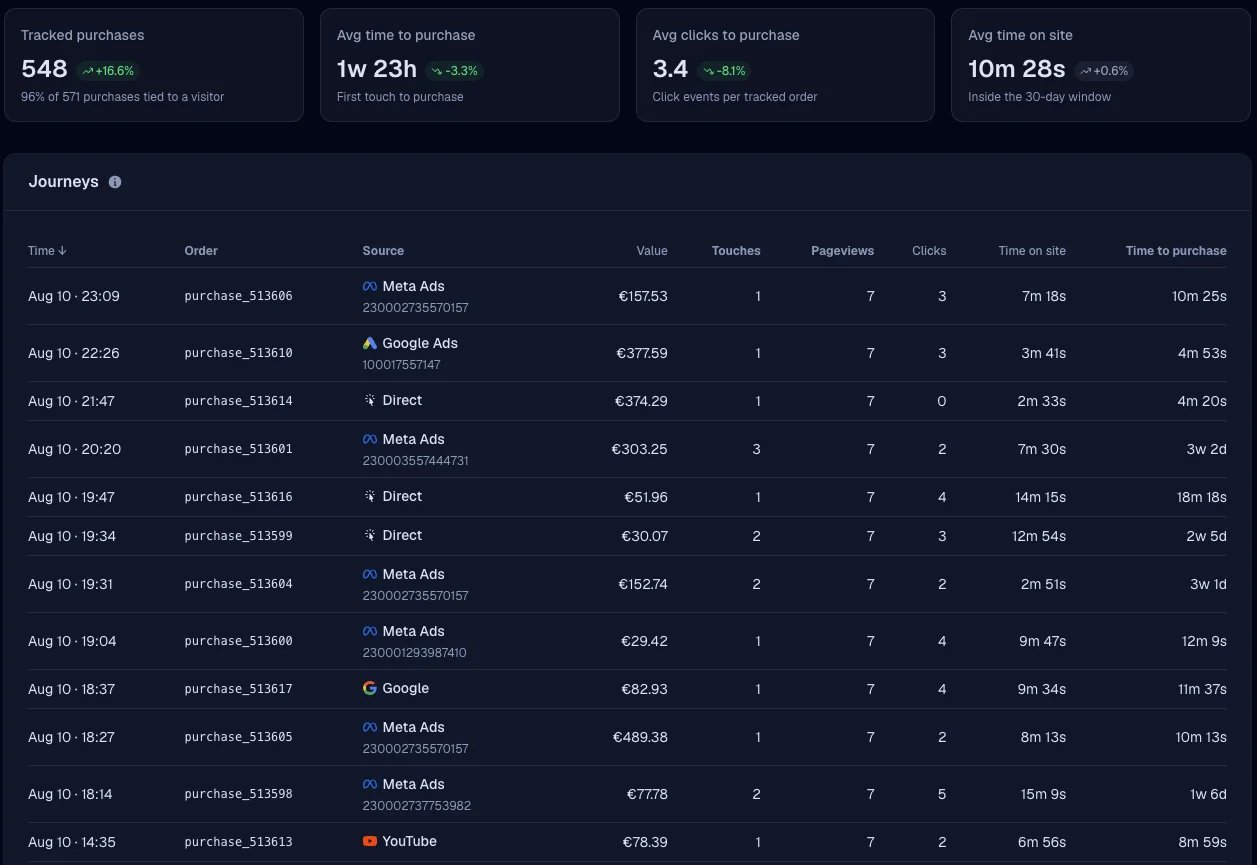
Purchase time, value, attributed source, touch count, time to purchase, page views: one row per sale.
Filter to the question
Slice by date, traffic source, country (with facet counts) or store, or search for one specific order.
Tiles that follow the filter
The summary tiles recalculate as you filter and show deltas against the previous period.
Re-credit the list in place
Switch the attribution model and every row re-credits where it stands. No export, no second report.
Open a purchase, read what produced it
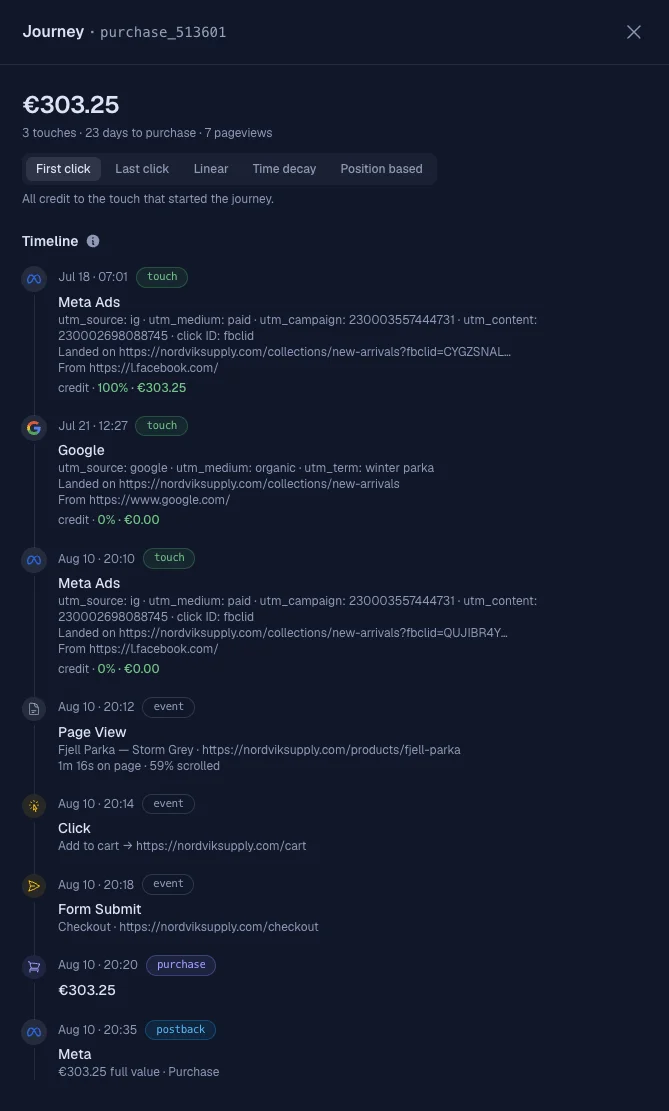
Every purchase opens a slide-over with the full touch → events → conversion timeline. Each touch carries its share of the credit under the model you picked.
Five models, visible splits
First click, last click, linear, time decay, position-based. The fractional credit sits under each touch, so the split is read, not inferred.
Verify revenue row by row
When a campaign's revenue looks off, open its purchases and check which touches earned the credit. There is no black box to argue with.
The postback, on the same receipt
Models split credit for analysis; the platform still gets one whole event. The last line records it: which platform, full value, by your first- or last-click rule.
These are the same models the attribution reports run on, applied to the same first-party events.
Deterministic records, not modeled guesses
A journey is assembled from the same click captures and conversion events the attribution runs on: first-party records, joined on hard identifiers.
Identifiers you can point at
A persistent visitor ID, a hashed email at signup or checkout, the store's customer ID. Every step in the timeline is joined on one of them.
Across days and devices
A click on Tuesday, a purchase next week on another device: when one identifier connects the steps, the journey holds together.
The records come from the same server-side tracking that captures your clicks and conversions in the first place.
Every journey is a link
“Look at this order” becomes a URL you paste, not a set of clicks you describe.
Stable URLs
Every journey has a permanent address, cross-linked from the Visitors list and the event log.
A read API
Pull the same list, summary and single journey your dashboard shows, from your own scripts and reports.
Start sending signals your ad platforms can actually use.
Connect your store, verify your events, and watch match quality climb. Free 14-day trial, no credit card required.