What the platforms claim, and what actually happened
Ad platforms grade their own homework. This report puts each platform's claimed revenue, ROAS and conversions next to what RoasProof measured from your own tracked conversions, and shows the gap between them.
The report blends ad spend pulled hourly from Meta, Google Ads and TikTok with revenue computed entirely from first-party data: your own conversions and click records. No third-party analytics call is involved.
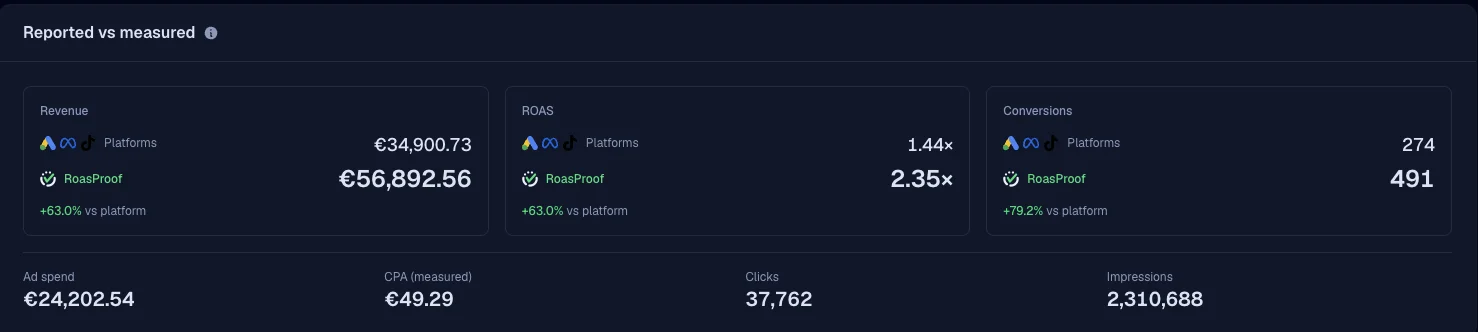
Two ROAS columns, one honest gap
For revenue, ROAS and conversions, every row shows the platform's figure next to RoasProof's, with the signed gap. When a platform claims 25% more or less than you measured, the cell tints.
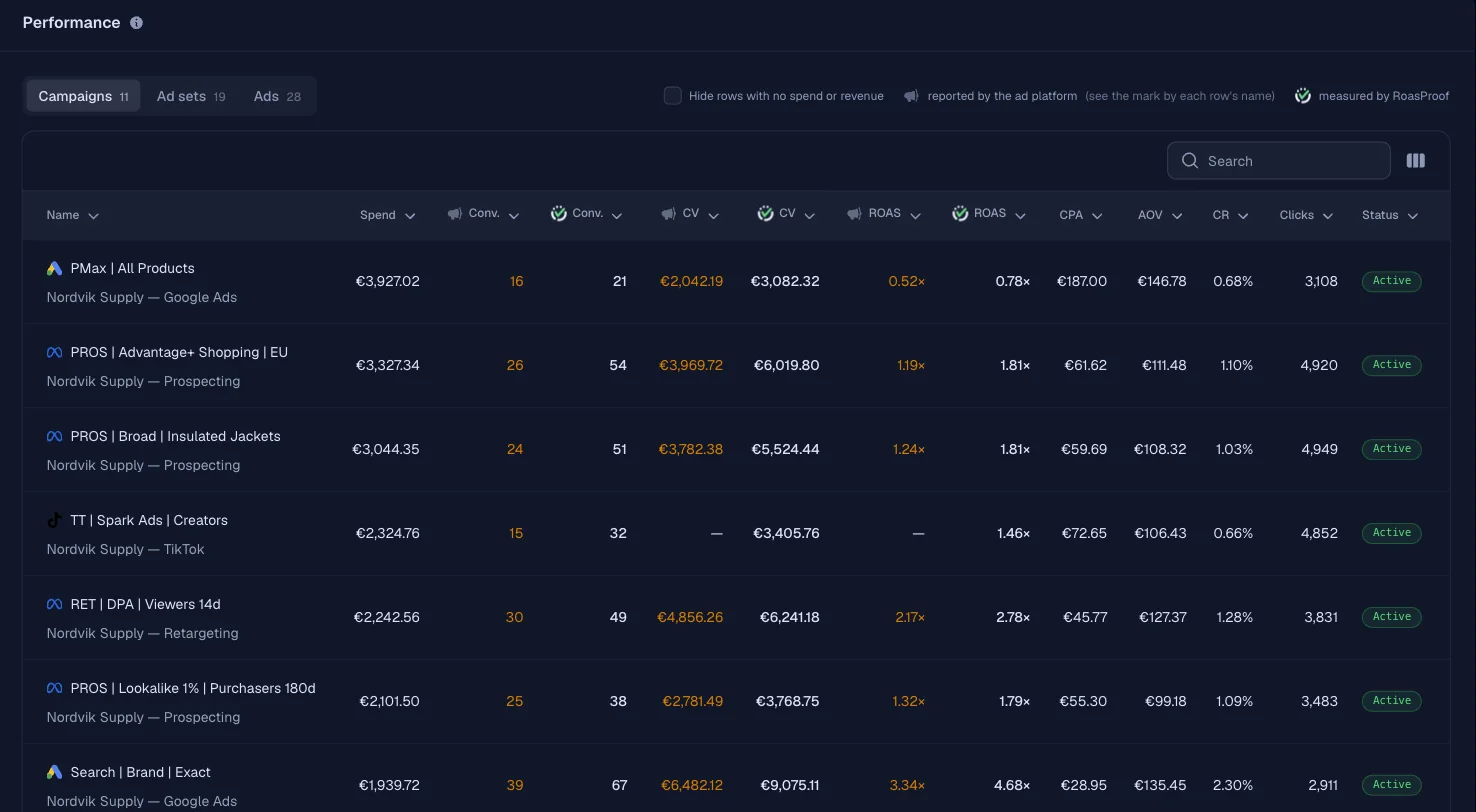
Measured spend, not estimated spend
Spend syncs hourly from Meta, Google Ads and TikTok, the only three spend sources. Platforms restate recent days, so a trailing ~3-day window is re-pulled, and a re-synced day replaces its rows, never sums them.
Five attribution models, everywhere
First click, last click, linear, time decay with a 7-day half-life, and position-based 40/20/40. The lookback window is configurable per workspace; the default is 30 days.
“—” is not 0.00×
TikTok reports no revenue claim at all, so that cell renders “—”, never a fake 0.00× ROAS. And revenue in two currencies is never blended into one total: two currencies means two rows.
Campaigns, ad sets and ads, down to the creative
Three tabs share one filter layer: attribution model, date range with presets and custom, store, ad account, platform, and a switch that hides rows with no spend or revenue.
The columns media buyers actually use
Spend, both revenue and ROAS figures, conversions, CPA, AOV, conversion rate, Clicks, Impressions, CTR, CPC, CPM, and a new-customer block: count, revenue, share, AOV. Hide or reorder columns; search finds the row.
The creative behind the number
Ad rows carry a creative thumbnail with a preview, so you check the asset without leaving the table.
Tagging health, diagnosed
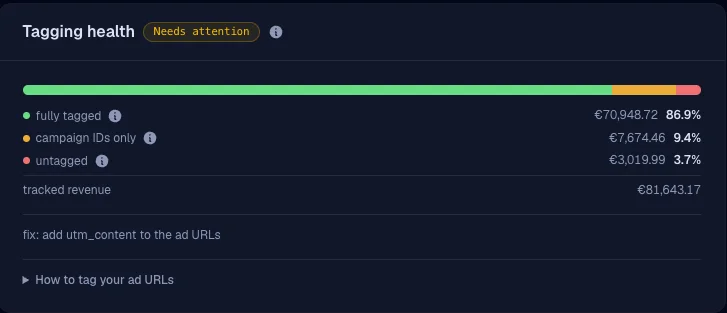
The report separates “nothing is tagged” from “only campaign IDs are tagged” (fixed by adding utm_content), shows a coverage bar, and flags campaigns spending with no attributed revenue.
Per-creative totals across every campaign live in the Creatives report.
The revenue no ad explains, counted too
Every conversion lands in a channel, with visitors, conversions and revenue per channel, per currency.
Visitors and conversions, not just revenue
Each channel shows its visitors, conversions and revenue: where the volume comes from, not just the money.
Klaviyo revenue, highlighted
Email revenue attributed to Klaviyo gets its own highlight: you know what your flows earn before an ad takes the credit.
For the click-by-click story behind one purchase, open its journey; for delivery health, the dashboard.
Reports clients can open without a login
CSV that honors your filters
Export campaigns, ad sets, ads or channels. The file matches what the filters show.
A digest on a schedule
A weekly or monthly email digest goes to the recipients you choose.
Read-only share links
Unbranded and revocable, with relative date ranges, so a bookmarked link stays current instead of freezing on last month.
Start sending signals your ad platforms can actually use.
Connect your store, verify your events, and watch match quality climb. Free 14-day trial, no credit card required.