Every number that matters, arranged the way you work
18 KPI tiles and 4 graphs, ROAS to signal delivery. Show what you use, hide the rest, drag it into your order. Saved per user, per workspace.

Your metrics, your order
No two accounts read a dashboard the same way. This one bends to you.
18 tiles, 4 graphs
From ROAS, CPA and AOV to CTR, CPC, CPM, budget pacing and delivery health. Show the tiles that earn their place; hide the rest.
Drag into your order
The numbers you check first belong at the top. Reordering is drag and drop, and the layout saves as you change it.
Personal, not shared
A media buyer and a founder open the same workspace and see different boards.
Last period is always beside this one
Every tile answers two questions: what the number is, and which way it is moving.
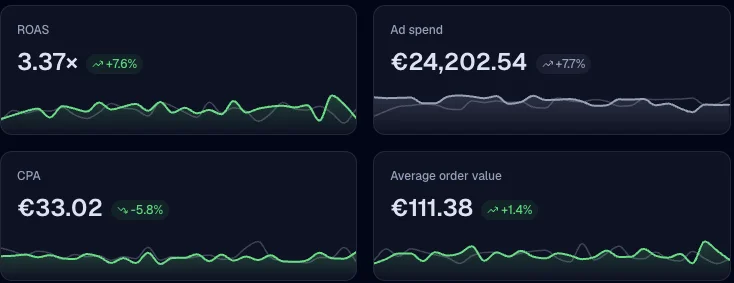
A delta on every tile
The badge is the change against the previous period, the first thing to read after the number.
A sparkline you can scrub
Scrub with hover or keyboard for any day's exact value; the previous period runs underneath as a muted ghost line, same y-scale.
No fake zeros
A metric with no data renders “—”, never 0. Mixed-currency views split per currency instead of blending money into a number that exists nowhere.
Period, channel, store, and channels you never set up
One filter row scopes every tile and graph at once.

Channels create themselves
Every traffic source and every raw utm_source from the last 90 days becomes a first-class channel. Tag a campaign utm_source=viber and “viber” appears, zero configuration.
One board, many stores
A workspace can hold several stores. Filter the whole board down to one, or read the workspace as a whole.
Four graphs, each with a table twin
Charts are server-rendered SVG, no client chart library. Every graph has a “View as table” twin: exact numbers, readable by screen readers.
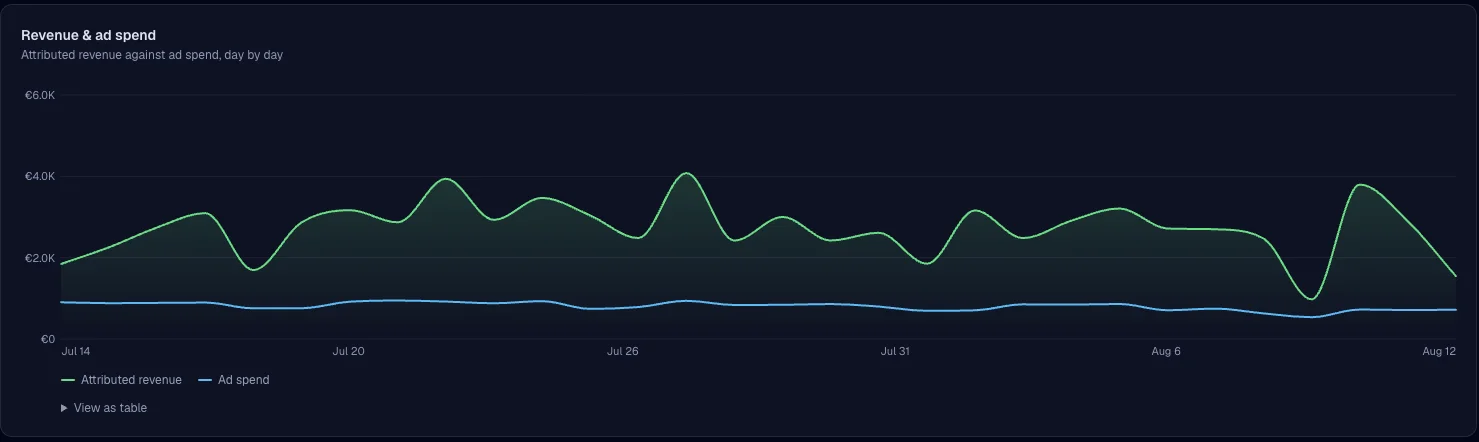
Revenue & ad spend
The two lines that decide whether the month works.
Conversions
Daily conversions with the first-time-customer share.
Top channels
Where attributed revenue actually comes from, ranked.
Signal delivery
Delivered against failed. A tracking problem shows up here before it shows in ROAS.
Attributed revenue is built by attribution. The pacing tile condenses budget pacing, and delivery health comes from server-side tracking.
Start sending signals your ad platforms can actually use.
Connect your store, verify your events, and watch match quality climb. Free 14-day trial, no credit card required.